July 1st is coming up, and with it, Grand River Transit is raising fares.
Every year, the fare increase is put under scrutiny. On the one hand, fare increases are natural, and make sure that inflation doesn’t starve our transit system of revenue needed to keep the buses running. On the other hand, steep fare increases can damage ridership.
Which hard choice is going to be made? Are we going to raise monthly passes the most, hitting loyal riders? Or are we going to raise tickets, so the burden is placed on the occasional rider instead? Do we raise cash fares, and hit those who may not be able to afford a whole strip of tickets at a time?
Which way does this year’s change lean? How do this year’s fare changes compare to previous years? And what does that say about the transit system we have?
That’s a lot of questions, and to dive into them, we first need to see what’s changing
GRT Fare Change, July 1, 2016
On average, GRT was aiming for a 5% fare increase. This year cash fares, unchanged since 2012, are taking the brunt of that increase, at 8.3%. Monthly passes get a much lower 3.8%, but that’s still twice the rate of inflation.
This kind of increase is clearly aimed promoting the use of monthly passes. GRT wants riders to become regular riders, and don’t want to scare them away with a suddenly more expensive pass. Occasional riders will have to make up the difference.
But wait a second. Wasn’t this the same compromise that was made last year? And the year before that? How have these fare increases been stacking up over the years? A little investigation, and here are the past 10 years of fare increases for GRT:
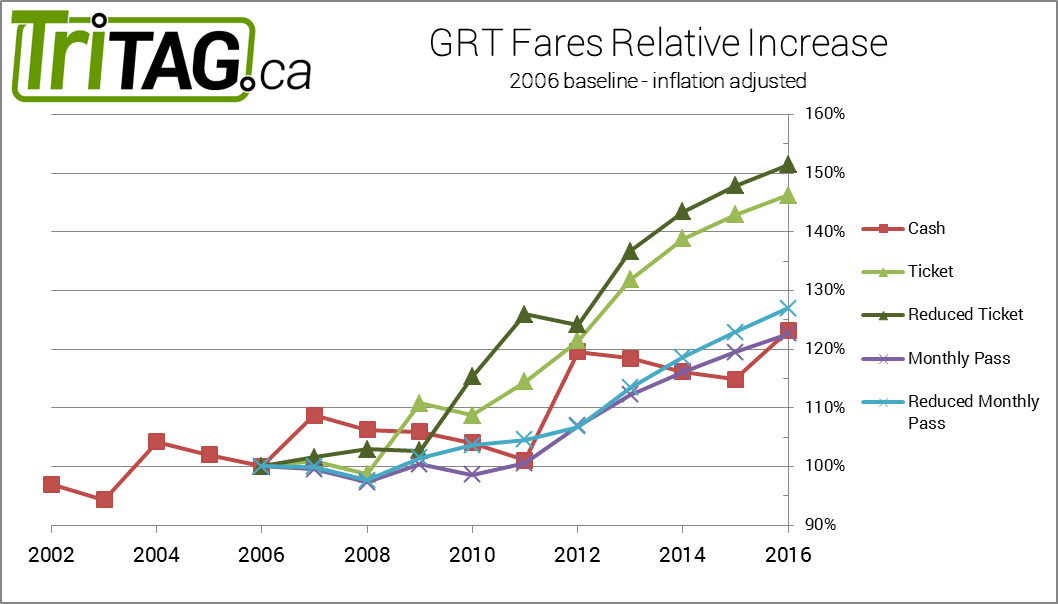
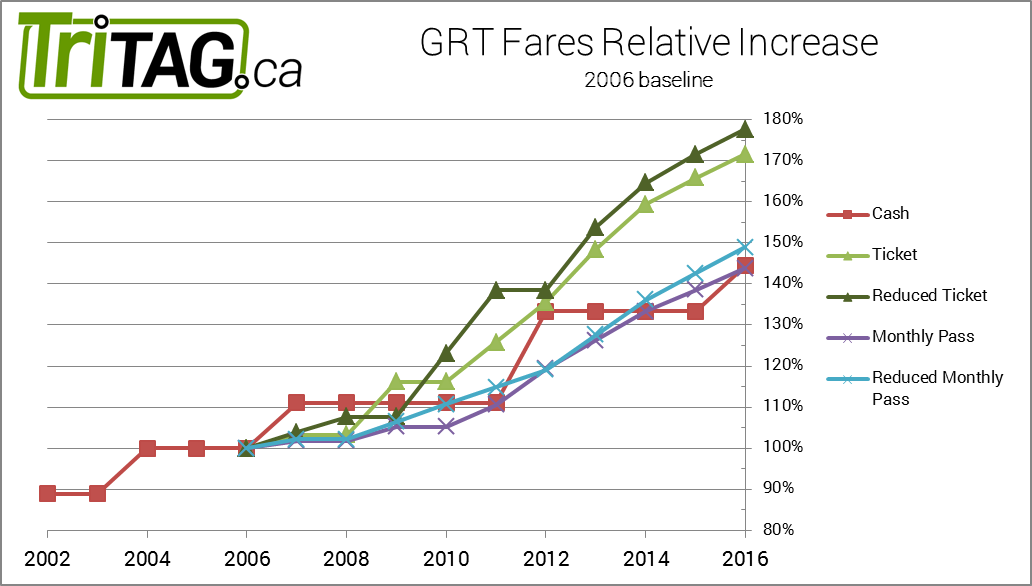
Relative GRT fare increases, as a percentage since 2006, adjusted for inflation (See also without adjustment)
Woah, that’s quite the jump in fares. One thing that really stands out are the fare increases of 2012-13, when Regional Council gave GRT a mandate to work towards 50% farebox cost recovery. The GRT 2011-2014 Business Plan called for 50% cost recovery from the fare box, and proposed up to 9% increases per year to meet that goal. We’ve written in the past about the need to be careful about precipitous fare increases for transit. The 9% increase in 2012 brought strong words against council. It’s reassuring to see that the large increases of those years have been tempered, though the 5% annual increases are still pushing the real cost of transit up every single year.
Over the past 10 years:
- Cash fares have risen 23%
- Adult Tickets have risen 46%
- Adult Monthly Passes have risen 23%
- Reduced (Senior/Child) Tickets have risen 51%
- Reduced Monthly Passes have risen 27%
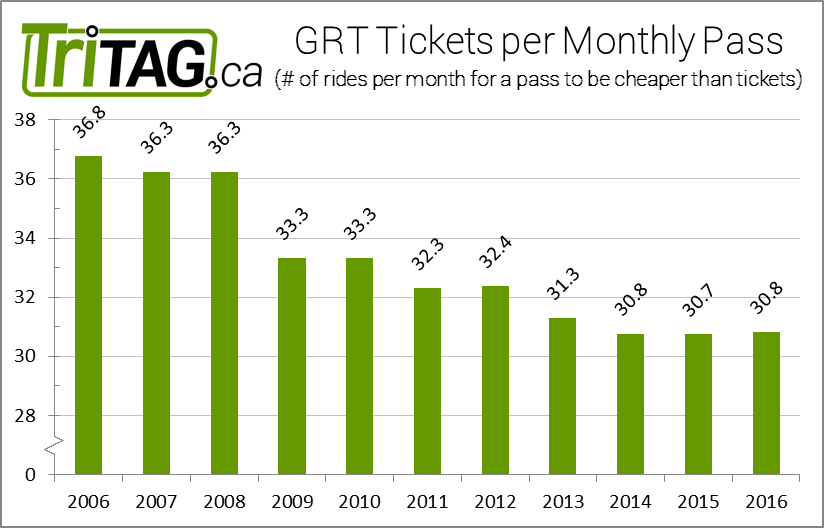
The number of bus rides you need to take for a monthly pass to be cheaper than tickets
Through these small changes, year over year, the relative cost of a monthly pass compared to tickets has been dropping. The number of rides per month to justify the purchase of a monthly pass as opposed to tickets has dropped from 37 rides in 2006 to 31 rides in 2016. A person needs only to make a round trip 16 times a month for a monthly pass to make sense. The average full time job has 22 working days a month, making that a dead simple choice, even when vacations and holidays come up.
When you consider that there is an even cheaper Corporate Pass available through many employers, and passes are eligible for the Federal transit pass tax credit, the number of rides needed drops all the way to 23, or 12 round trips. The value afforded to monthly pass riders is substantial.
The Others
With this general trend of keeping monthly pass costs lower, the occasional rider is being punished.
Tickets have been taking the brunt of the increases over the past 10 years, raising 50%. Tickets are used by occasional riders, and those who may not have regular jobs. Someone working 10 days a month has had their transit costs go up much more than someone working full time on a monthly pass, and yet the person using tickets will be less able to afford such an increase.
Cash fares have not been raising as fast, but the increase to $3.25 has made it more cumbersome than the old price of $3, now requiring you to find a Toonie, Loonie, and a Quarter in your pocket. Cash fares are often the first experience a rider has with a transit system. When someone doesn’t have exact change, they’ll be less likely to try taking the bus. With relatively cheap “rideshare” alternatives like Uber and RideCo now appearing, GRT may start to lose those first interactions with people who could take the bus, but can’t be bothered to figure out if they have the correct change.
Final Words
GRT and Regional Council should take a look at how these changes line up with their overall goals for transit in Waterloo Region. Are cheaper monthly passes to encourage daily riders the best bet? Or should tickets and cash fares be kept low, to encourage new riders who might then become monthly pass owners?
Either way, let us make sure that it is not simply an accident of a dozen individual fare increases, and is the true direction intended for GRT.
Stay tuned for future posts talking about fares, as we compare GRT to other Canadian cities, and look at how fares could be handled differently with the coming change to electronic fare cards.
And as a point of comparison, direct costs to drivers from within Waterloo have been basically frozen for a few years as far as I understand, namely, zero in costs for driving, and the few places which cost to park in Uptown, I believe have seen frozen rates for more than a year as a result of construction. I realize these are different governments, but still, the contrast should be stark.
Also, and I realize this might be more work, but it is worth comparing fare prices with revenue service hours, as well as ridership.