Why ION cost estimates went up (and what to do about it)
The cost estimates for the ION light rail extension have had many scratching their heads. Transit construction costs have ballooned in North America and beyond, but right here in Waterloo Region we built ION Stage 1 for under a billion dollars, less than a decade ago. Why would the price tag be over $3 billion for a similar length extension? It’s a big question! In this article, we will try to understand the story of ION cost estimates to date. We’ll take a look at Stage 1 costs, the evolution of cost estimates, what can explain the changes, and what we should do about it.
Stage 1
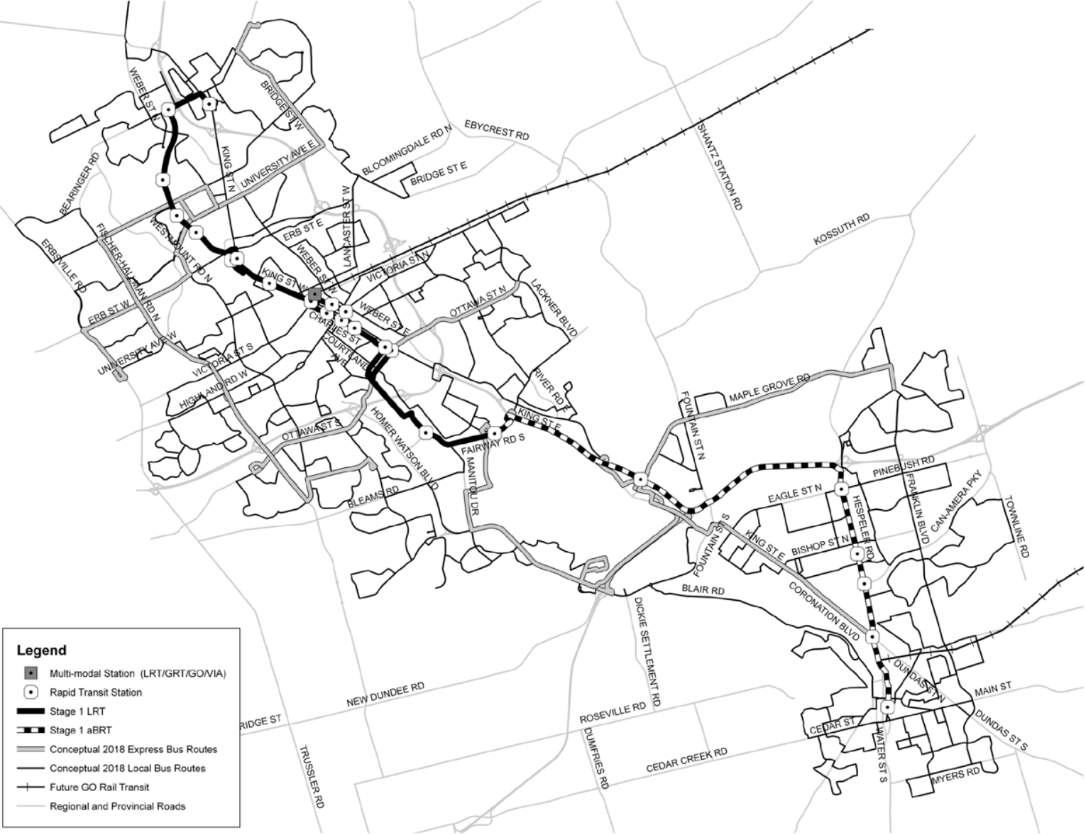
First, some basic context about ION. It’s a light rail line (i.e. tram) through the cities of Waterloo and Kitchener within the upper-tier Region of Waterloo. End-to-end, the Stage 1 portion is 16 km, fully at grade on dedicated lanes and along rail and hydro rights-of-way. It was optimized/compromised to get stakeholders on board to get it built, but it is nevertheless a basic system – one which is working quite well now.
In 2009, the Region of Waterloo decided to proceed with a staged light rail plan, with a light rail section spanning Waterloo and Kitchener, and an express bus section from there to Cambridge. This was based on a cost estimate of $790m for the capital cost and initial vehicles. The line extending to Cambridge was the full concept, but wasn’t considered feasible with available funding, and that was planned as Stage 2.
The Region then went to work to get upper-level government funding for the plan, which they did in 2010. They were hoping for one-third from the federal government, and they got one-third up to $265m. They were also hoping for two-thirds from the provincial government, but only got $300m. The rest would have to come from the local government, which has few revenue tools other than property taxes – and increasing those for a project is a big political cost.
Thus the fall 2010 municipal elections had the light rail project as a key focus, with some candidates running on cancelling it, and those supporting it talking about getting costs down. Pro-LRT candidates got re-elected, though in response to public cost concerns and a Council request, staff came back in early 2011 with another look at light rail (LRT) and bus rapid transit (BRT) implementation options, with additional value engineering. The $790m in 2009 dollars became $1010m in projected 2014 start-of-construction dollars. Staff refined or reduced scope utility relocation, electricity supply, etc. to bring down the estimated costs to $818m (projected 2014 dollars) for the staged light rail plus express bus option.
This is what the subsequent consultations oriented around, and what was ultimately approved by Regional Council later in 2011. Council supported a property tax increase of 0.7% per year for seven years to support the operations, capital increases, and supportive Grand River Transit network improvements.
Stage 1 cost estimates
Construction projects generally distinguish between hard costs and soft costs. The former are for the materials, equipment, and labour for the physical infrastructure being created, while the latter are for all the supporting costs: design, oversight, program management, etc.
The cost estimates in 2009 broke out over a dozen categories of project hard costs, added 49% of those for soft costs, then added in the cost of vehicles.
| Category | Percent of hard costs |
|---|---|
| Engineering Design | 10% |
| Construction Management | 8% |
| Design Support (Construction) | 2% |
| Construction Change-Order Contingency | 10% |
| Agency Costs | 6% |
| Project Reserve | 10% |
| Program Management | 3% |
That means the soft cost estimate is just under 33% of the system cost estimate. In the evaluation, multiple options were costed out, including full LRT, bus rapid transit (BRT), and the hybrid LRT + express bus option we ended up with. The estimates for full LRT give us a clearer picture of costs per kilometre – there the total hard + soft costs come to about $33m / km of light rail in 2009 dollars, which is a reasonable figure internationally.
Stage 1 actual costs
The Region of Waterloo went with a public-private partnership procurement (P3) model, specifically DBFOM (design-build-finance-operate-maintain). This was driven by provincial pressure, as well as a desire to transfer some risk to a private partner. The Region went through a complex process with pre-qualification, a value-for-money assessment, a fairness monitor, and a lot of work in putting everything into a contract that would last not just for construction, but also for a 30 year maintenance and 10 year operations term.
In March 2014, the Region awarded the contract to the GrandLinq consortium, made up of finance, development, construction, and operating partners. It was the highest scoring team and the lowest bid of the several contenders.
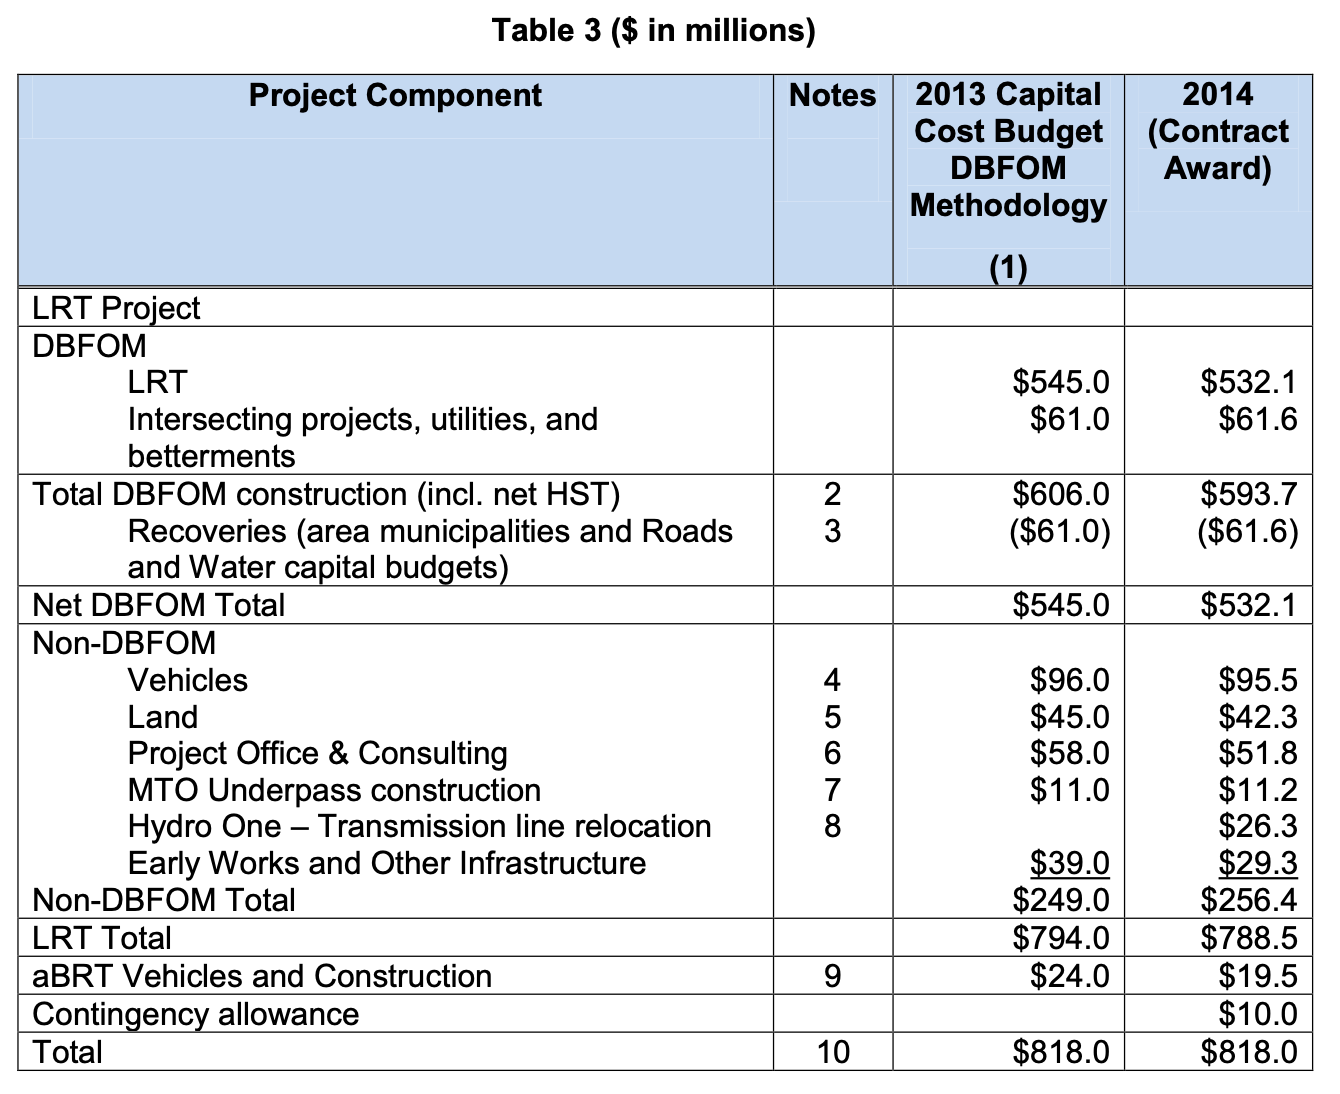
By this point, some of the construction was already undertaken separately by the Region directly and through other parties. At the same time some of the work within the contract, e.g. to replace some utilities, was funded from outside the rapid transit budget. Overall, leaving a $10m contingency, this ended up exactly at the $818m cost estimate.
It is hard to say from the outside to what extent the bid expanded to fit the available budget, or to what extent the designs were cut down to what could fit. Subsequent to ION getting built and opened, we have heard that GrandLinq believes it lost some money on the deal and attempted litigation against the Region to get paid more, apparently unsuccessfully.
But ultimately, ION was built relatively quickly, it has been operating quite well, and there don’t appear to be any important corners cut. So it seems fair to conclude that the Region’s original cost estimates and procurement oversight were pretty good.
Interlude: the transit cost problem
As ION Stage 1 was being planned and built, transit construction costs were rising precipitously in the US, Canada, and beyond. The Transit Costs Project spun up to understand why, publishing a detailed report on the issue. There have also since been detailed reports about transit costs in the Canadian context from the University of Toronto’s School of Cities and from the CSA Public Policy Centre.
There is much more to those reports than we can summarize here, but some of the flavour is:
- Overbuilding: building bigger stations than necessary, increased project scope, unnecessary features
- Lack of standardization: different materials and designs used for different stations
- Low in-house expertise: too much reliance on contractors and consultants with insufficient internal oversight
- Change orders and contingency costs: political shifting of winds, insufficient discipline in project direction, and that being incorporated into budgets
- Lack of competition: overly-customized requirements reducing eligible contractors, lack of unit cost transparency elevating material costs
These issues spread in a way that seemed to be contagious. Transit went from something agencies and government could treat as a project to be delivered like other infrastructure, to a boutique specialized system.
Projects in the Greater Toronto Area highlight this. TTC’s Sheppard West extension to the Toronto subway in the 90s cost less than $100m per km and the Sheppard line in the early 2000s was ~$200m per km. These are both full grade-separated tunneled subways. More recent projects have been several times that, and even the almost entirely at-grade Finch West LRT came in at over $300m per km – close to ten times the cost per km of ION Stage 1.
Construction inflation is a factor, but there are high-labour-cost countries that haven’t seen ballooning costs like this. For that matter, the REM line in Montreal was recently built for under $200m per km for a fully grade-separated automated light metro. The unevenness suggests that the costs are not a new fact of life, but a consequence of choices in project management and delivery.
How Stage 1 kept costs down
A recent video from Oh The Urbanity! highlighted some of the factors that helped ION Stage 1 get built for a reasonable cost.
The Region knew what it wanted from the project early on. It hired a sizeable in-house team including project managers and engineers to navigate the details. It also took charge of the project politically, with a rapid transit steering committee in the early days, and later consistent oversight within the Region’s Planning & Works Committee. Multiple Regional Councillors were project champions, providing urgency and momentum to the project team, and supporting it publicly so that it wouldn’t get mired in any details. Similarly, there was a public base of support, including through TriTAG, that provided feedback in a context of clear backing for the project direction.
Once the project was a go, there was no political waffling about the route or other details. It was full steam ahead.
The Region cared about costs from the outset, figuring out how to use a freight rail alignment and a hydro corridor for a good chunk of the route. It was willing to contribute local funds to get the project built, and that also meant it had skin in the game. When the federal government and provincial government didn’t provide full funding, the Region figured out how to get the costs down to something it could afford.
The Region used a P3 arrangement, but did its homework so the project specifications were clear and the private consortium could work within it to deliver the project. For what it’s worth, the Canadian Council for Public-Private Partnerships gave ION a gold award for service delivery.
Ahead of the big contract, the Region planned ahead to save on utility relocations and advance pieces with more coordination risk: building a new highway underpass, burying high-voltage transmission lines. It also joined Metrolinx’s existing light rail vehicle order for the Eglinton Crosstown LRT instead of going it alone.
At the same time, this was still the biggest infrastructure project undertaken by the Region and the organization did not have prior in-house expertise specifically around transit infrastructure. But the political will and effective project management and oversight was sufficient to get a good result.
Stage 2 planning
The ION plan had light rail for part of the corridor, with a firm political commitment to a Stage 2 that would build it out along the rest of the corridor. After construction got underway for Stage 1, the Region started consultation and study for a Stage 2 alignment and details. With ION, Waterloo Region was going to be the smallest urban area in North America with a modern light rail system, and it was not a foregone conclusion that it would be successful.
That’s an important point here for transit costs: we have a model where cities and agencies rely on upper-level government funding to build transit, but those funding sources are heavily political rather than based on any clearly laid out eligibility rules and funding formulas. It was doubtful that an extension could get funded before ION was shown politically to be a success. So the Stage 2 development did not proceed with urgency.
Stage 2 had several consultations over 2015 to 2019, with Council endorsing an updated route and then another updated route. During this period the project staff team shrank; we don’t have firm numbers, but it seems to have been smaller than the project team at similar points for Stage 1 and more reliant on external consultants for planning the project. ION Stage 1 opened in June 2019, so the pandemic transit downturn the following year likely further reduced momentum on the work. However, staff prepared an environmental assessment and got the necessary provincial approval in June 2021. In December 2023, Council endorsed another route tweak.
Finally, in November 2025, after seeing the initial business case and considering shorter alternatives, Regional Council approved proceeding with the full light rail extension - seeking full upper level capital funding and starting pre-construction work in the meantime. Council also supported funding several Stage 2 project team roles for the 2026 budget.
This is where we’re at today. The Region of Waterloo is seeking funding from the provincial and federal governments for ION Stage 2, with a most recent capital cost estimate of $3.13b in 2025 dollars. Let’s figure out how we got to that figure.
Stage 2 estimates (2011)
In 2011, Waterloo Region only recommended building part of the route as LRT – but it did estimate costs for the whole route. Using those figures, we can infer that at that point, Stage 2 was estimated as $732m in 2014 dollars, with a soft cost proportion of 33%. See Appendix 1 for more details.
In hindsight, we know that the Region’s 2011 numbers were pretty much right, so their estimation methodology was not out to lunch. They were ultimately able to hire a consortium to build Stage 1 for the estimated cost; there were some overruns attributed to Bombardier vehicle delivery delays, but with a net impact under $50m.
The Stage 2 alignment has changed somewhat since 2011, but some of the civil works complexity of Stage 2, with the need for new river crossings, was already present.
Interlude: access to information
One of the themes in the transit cost literature is transparency, or rather the lack thereof. When the details of projects are hidden for fear of weaponization, and component costs are hidden as commercially sensitive, the result is that it’s harder for the public and decision-makers to see why they’re not getting a good deal and what could be done about it. Conversely, mandated sharing of details, including per-unit costs, can make it easier to avoid overcharging by suppliers.
For ION Stage 1, the Region of Waterloo’s rapid transit project team shared information abundantly on their website: public consultations, reports to council, monthly project updates, as well as detailed studies, the request for proposals, and almost the entire Grandlinq project agreement governing construction and operations. Sometime in the years since, that website disappeared when the Region of Waterloo replaced its website, however it is largely preserved on the Internet Archive.
The ION Stage 2 project team is smaller, as is the ION Stage 2 website. It has all the council reports, public consultations, and the environmental assessments, but perhaps not as much detail. In particular, it does not have the Stage 2 cost estimate documents – we had to file a freedom of information request to see those. Even then, some detailed costs were redacted. Per the provincial legislation, the Region first consulted with third parties – presumably GrandLinq or the cost consultants – before releasing the records, with "certain sections withheld under Section 10 and 11 of the Act for protecting third party information and the Region’s economic and other interests."
Stage 2 estimates (2016)
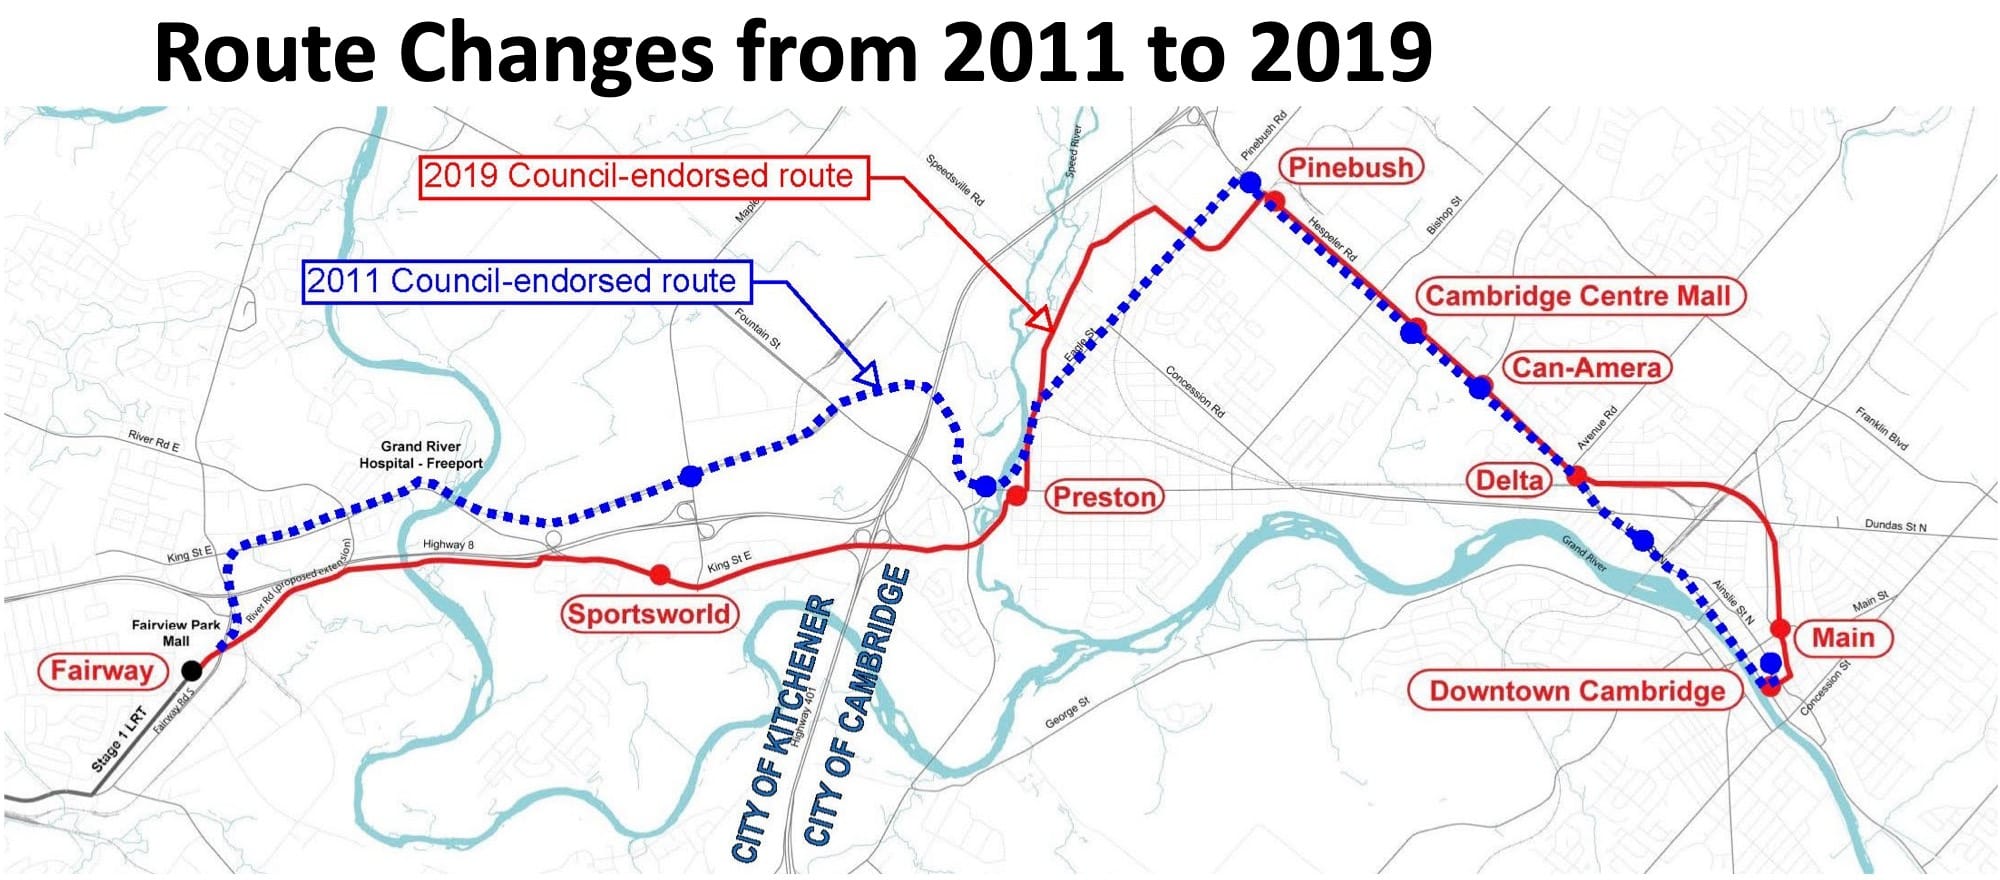
When the assessment for Stage 2 got underway in earnest, there were some route changes from the line as it was envisioned in 2011. It sounds like CP may not have been keen on the use of their active freight rail corridor. Instead of following the CP rail line from Fairway Road in Kitchener to Preston in Cambridge, it would stick to the south side of Highway 8, then travel along King Street East with a flyover down Shantz Hill and over the Speed River into Preston. There are more elevated sections and longer bridges needed with the new alignment, so higher costs are not surprising.
In the 2016 cost estimate, soft costs are again added in a relatively straightforward way as a proportion of hard costs:
| Category | Percent of hard costs |
|---|---|
| Engineering Design & Design Support | 15% (not including utilities & vehicles) |
| Project Management | 10% (not including utilities & vehicles) |
| Construction Change-Order Contingency | 40% (not including vehicles) |
| Program Management | 4% |
In 2016 dollars, the presented estimate is $1.13b, of which $140m is for vehicles, $43.6m is program management, and the remaining $949.3m is the cost for the construction segments. Frustratingly, the detailed segment cost estimate breakdowns are redacted.
However, using some reasonable assumptions and working backwards (see Appendix 2), we can infer that hard costs are $593.3m and soft costs make up 40.2% of the total. The prior estimates were $490m for hard costs, with soft costs 33% of the total. The hard costs seem to be in line with slightly increased route complexity and several years of inflation, but the soft costs have gone up. In particular, while some line items are absent, contingency is up from 10% to 40%.
Stage 2 estimates (2022)
In 2022, the Region hired consultants for new, independent capital and operating cost estimates, in order to prepare a business case to submit as part of upper-level funding requests. The business case would be largely based on MTO and Metrolinx frameworks, and the approach would consider how other relevant projects obtained funding. The cost estimates also considered shorter sections and would presumably better account for the high levels of construction cost inflation that were occurring during the Covid pandemic.
These new estimates were in the $3-4b range, with varying versions getting top billing, largely dependent on whether they escalated costs to the year 2033 and explicitly included a contingency amount. In April 2023, these were presented to Regional Council:
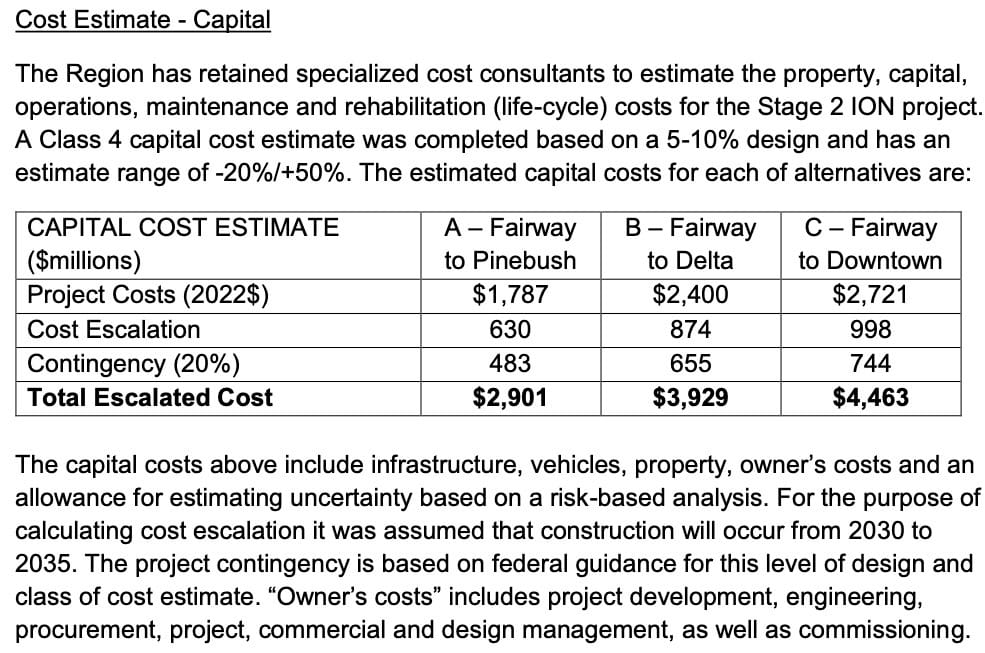
The details of this, with compounding layers of costs, are much more complicated than prior cost estimates, and complex enough that we had to put them in an appendix - see Appendix 3 for more analysis. But the core of this is a construction cost estimate excluding vehicles of $2.39b in 2022 dollars, with 54.2% of that as soft costs.

There was substantial pandemic-era construction inflation in this time period that likely accounts for much of the hard cost increase from $593m in 2016 to $1.03b in 2022. The soft cost story is different, however. Per the Region’s reports and the estimation document, these estimates are heavily reliant on current similar projects in the Greater Toronto Area – rather than on ION Stage 1 – as a guide to costs. In 2022, Metrolinx did not have a great reputation for delivering transit projects on time and on budget, but since 2022, that agency’s notoriety for poorly managed transit projects has only become a bigger story.
The hard problem of soft costs

Normalizing the ION Stage 2 cost estimates based on construction inflation (see Appendix 4), we can see that hard cost estimates for the project have grown substantially above inflation. But clearly the bigger problem is ballooning soft costs.
Any data from Metrolinx is going to reflect that agency’s track record of projects going over time and over budget, even considering their starting high budgets. Recent projects have seen political interference that changes project direction and adds complexity, with little accountability for project delivery and insufficient ownership. This isn’t unique to Metrolinx and shows up elsewhere in projects with poor management or political support.
These are the kinds of things that high percentages for contingency try to account for. This isn’t so much pricing in surprises during construction, but pricing in political waffling on the project, scope creep, and a lack of cost discipline.
As documented by the School of Cities report, the problem with this logic in Metrolinx projects is that it leads to costs ratcheting up. If a budget is allocated for unnecessarily high project costs and funding is obtained, then everyone involved sees the pot of money and it reduces the pressure for cost-effective delivery. That’s something Waterloo Region political leaders were aware of for Stage 1 ION:
The project was given a contingency fund of 1.5 per cent of its total budget. Normally, Galloway says, the amount budgeted to handle overruns and unexpected costs falls between five per cent and 10 per cent. A 7.5 per cent contingency would have brought the total cost to more than the new budgeted cost of $868 million.
“We wanted to hold staff and contractors’ feet to the fire and not have a cushy contingency,” Galloway said.
In a procurement model where the entire project is awarded to a single consortium, bidders have a strong incentive to put forward bids that add more nice-to-haves with less regard to costs, as a way of having a more competitive bid that’s still within budget.
This is a system where because costs might go up, they do go up. Now, transit costs have ratcheted up to levels at which it’s become hard to fund projects. We need to figure out a different path.
Where should we take ION from here?
In an ideal world, we wouldn’t have stopped at opening Stage 1, but would have kept building. But even ION Stage 1 was politically challenging. Without clear formulas for funding projects, project funding is political – and ION needed to prove itself. As a result, after Stage 1, the ION project team dwindled and eventually was down to just one full-time staff lead.
But now, ION is operating successfully and we know that with the political will, supportive land-use, a well-integrated transit network, and cost-effective project delivery, we can get great higher-order transit in a smaller, still car-oriented municipality.
The first lesson is a jurisdictional one: we should make sure the Region of Waterloo is the one delivering ION’s Stage 2 and not have it given up to Metrolinx. The regional government has the political momentum behind this project and it has the track record of getting Stage 1 built well. Recent news saw responsibility for leading the Waterfront East LRT go to the City of Toronto rather than Metrolinx, so it’s not just us thinking this.
Currently, the Region of Waterloo has pending funding requests to the provincial and federal governments for the full capital costs to build ION Stage 2 to Cambridge. So far there has been no indication about upper level willingness to fund it, and it is unclear if we will see that before the municipal elections in the fall.
So should the Region be asking for less money for Stage 2? Today, probably not. First, it’s possible that the upper level governments will answer that for the Region by making less funding available. And though the Region delivered ION Stage 1 effectively, it can reasonably worry about whether it too has been irreversibly stricken by a contagious cost disease. Without good municipal revenue sources, dealing with cost overruns is very difficult politically.
It is also true that the transit investments in peer municipalities really are at those high levels, with the province putting $4.6b into Hurontario LRT in 2019 and upper levels providing $3.4b for construction of Hamilton’s LRT. Why shouldn’t Waterloo Region – which has shown great success with ION – get similar investment for expansion?
This leads to what we think is the way out here - maybe just for Waterloo Region and ION, but perhaps beyond that. Rather than seeking funding for a single ION project, the Region should seek funding for an ION expansion program, in which it has incentive to save to leave budget room for more projects. Use everything we know from ION Stage 1 and successful projects elsewhere to deliver ION Stage 2 incrementally and cost-effectively. Build up in-house project management expertise, and save as much on funding the Stage 2 pieces as possible – so that there is funding to build more transit.
Incremental progress means we can get value sooner. Going step by step means that the project team and a support base of qualified contractors have work to do on the design, study, or preliminary work for a next step while the current step is being delivered. It means more opportunities to learn and improve in getting transit built. Upper level politicians get more ribbons to cut, and the public sees more momentum from a transit network that is tangibly expanding.
Just like Waterloo Region went against received wisdom in showing that LRT can succeed in a smaller North American municipality, let’s have Waterloo Region show a way out of the transit cost spiral.
Acknowledgements
Richard Si, Allie Beldan, and Simha Kalimipalli provided helpful feedback on drafts of this article. Thanks also to Jedwin Mok and Marco Chitti for helpful discussion about construction costs.
This post is part of TriTAG's IONizeWR campaign.
Do you want more analysis on the ION LRT, with a focus on how Waterloo Region can improve and expand the system to create a complete, reliable rapid transit network?
Consider subscribing to our IONizeWR newsletter!
Appendix 1: 2011 cost estimates
In the 2011 report which recommended proceeding with a phased approach, there were 9 implementation options with various lengths of light rail. L3 (LRT from Conestoga Mall to Fairview Park Mall & aBRT from Fairview Park Mall to Ainslie St Terminal) was 19km of LRT with an estimated capital cost of $818m in 2014 dollars. L9 (LRT from St Jacobs Farmers’ Market to Ainslie St Terminal) was the full length LRT option: 39km of LRT with an estimated capital cost of $1550m.
L3 is what was built, and L9 is roughly what we’ll have with the addition of Stage 2. Both estimates include identical costs for vehicles. So we can assume that their difference is attributed to the construction cost. The full length LRT option didn’t include the relatively small costs for the “adapted BRT” section, but it did include the full Stage 2 light rail alignment, plus a couple more kilometres between Conestoga Mall and the St. Jacobs Farmers Market.
So that implies that the Stage 2 cost estimates in 2011 would’ve been less than the difference in costs between L3 and L9, or $732m in 2014 dollars, with soft costs about 33% of that.
Appendix 2: 2016 cost estimates
The 2016 estimates we obtained give us percentage figures for soft cost components and give us a total, but the hard / cost breakdown is redacted. But we can figure out the number for hard costs with some algebra.
The soft cost figures apply differently to utilities. We don’t know the figure for 2016, but in the 2009 cost estimates, utilities were about 20% of the hard costs. If we assume that here, and suppose that X is the hard costs amount, then hard costs can be broken up into utilities and everything else:
X * 0.8 for non-utility construction
X * 0.2 for utilities
For non-utility construction, there are soft costs of 15% (design) + 10% (project management) + 40% (contingency) of hard costs = 65%. So hard plus soft costs is X * 0.8 * (1 + 0.15 + 0.10 + 0.40) = X * 1.32
For utility construction, there are soft costs of 40% (contingency) of hard costs, so hard plus soft costs is X * 0.2 * (1 + 0.40) = X * 0.28.
Combining those, we have X * 1.32 + X * 0.28 = X * 1.6 as the total of hard plus soft costs for the construction segments, which we know from the estimates is $949,274,938. Dividing by 1.6, we get X = $593,296,836.25, or $593.3m in hard costs.
If we include the $43.6m figure for program management, the soft cost ratio is then (949.3 + 43.6 - 593.5) / (949.3 + 43.6) = 40.2%.
Appendix 3: 2022 cost estimates
The 2022 cost estimates released to us unfortunately redact the detailed unit cost breakdown, but they still provide helpful information about what makes up those project costs:
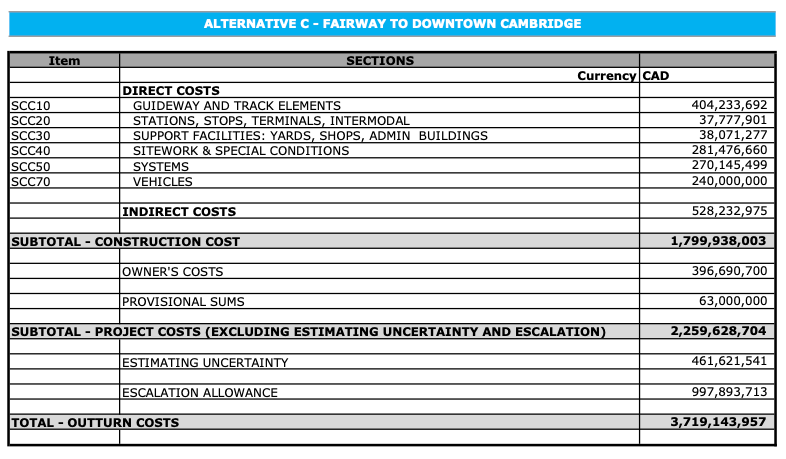
We can see that the hard costs have gone up, but the soft costs have gone up more. And there’s layers here: while in the previous estimates, soft costs are added proportionally to hard costs, here that’s done in several steps. 37% of direct costs minus vehicles is added for contractor’s design, site services, project management, etc. Then 12% is added to the result for contractor overhead. Then for that plus vehicles, 15% is added for the Region’s project development and delivery. Adding a smaller provisional sum for specific third party integrations gets us to $2.26b. Then adding ~20.5% for estimating uncertainty gets us to the $2.72b project cost figure, in 2022 dollars.
If you’re not lost yet, 36.7% of the 2022 project cost is added to get an escalated 2033 project cost, and then 20% is added as contingency to arrive at the total escalated $4.46b figure in 2033 dollars.
The vehicle costs are a particularly odd aspect of this estimate. In 2013, the Region of Waterloo joined a Bombardier order for light rail vehicles and ordered 14 at an average cost of $6.6m including parts, tools, and contingencies. The 2016 Stage 2 estimate had this to say about the applicability of separate soft costs and contingencies to vehicle costs:
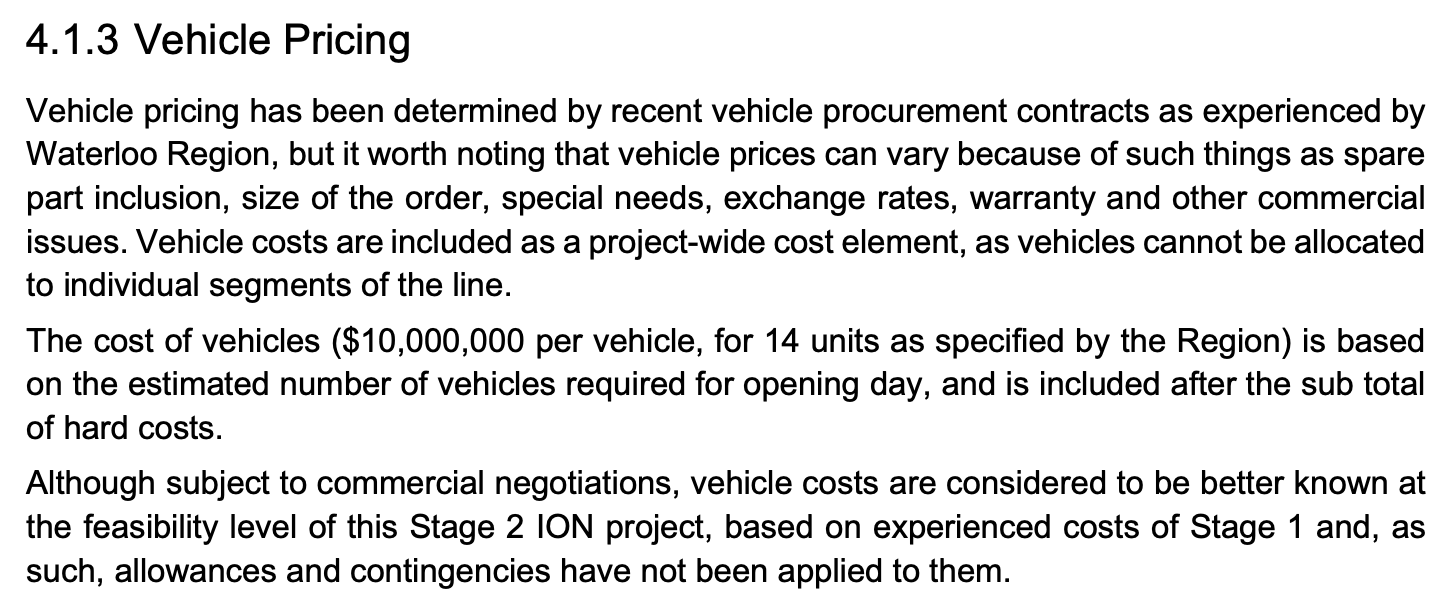
The 2022 estimate keeps that figure, saying:
“Indicative pricing of $10M per vehicle based on Procurement of Stage 1 Vehicles. The unit price takes into account customization and a smaller order than Stage 1 procurement in 2013.”
Less clear is why the Region priced out 24 vehicles – perhaps they are anticipating that extending the line would require an increase in overall capacity. Even harder to see is why 15% project development & delivery and 20.5% estimating uncertainty were added for vehicles in the 2022 estimate, with the result that they make up $333m of the $2.72b project cost estimate.
Now, back to the hard costs. If we ditch the last layer of contingency and back out to 2022 figures – without the vehicles – we have a total of $2.39b, with $1.03b of those being hard costs, or a 54.2% soft cost percentage. There was substantial pandemic-era construction inflation in this time period which likely accounts for a large part of the hard cost increase.
Appendix 4: Construction cost inflation

To be able to compare estimates from different time periods, we need to factor in inflation – and construction inflation has been even higher in recent years than other kinds. To that end we used StatCan’s building construction price index, specifically their non-residential composite across a sample of census metropolitan areas. This gives us an imperfect but good enough proxy for transit-relevant construction costs. To compare across years, we averaged the index for the given year, and then normalized estimates to StatCan’s index year 2023.
Appendix 5: Resources
- Selected reports and data powering our charts
- Stage 2 cost estimates released in Freedom of Information request
- Transit cost research
- Archived Stage 1 ION website
- Current Stage 2 ION websites
- Project homepage (documents up to 2021)
- EngageWR (documents since 2021)
- Documentaries
- Growing Up: The story of ION light rail in Waterloo Region (Region of Waterloo)
- How This Small City Built Light Rail For Cheap (Oh The Urbanity!)