On The Fast Track: How to Make ION Even Faster
With Toronto’s Finch West LRT recently in the news for its slow travel times, it’s fair to ask how ION compares. Put simply, it’s pretty good, but could be a bit better. As the Region of Waterloo prepares for Stage 2 to Cambridge, we’re breaking down the factors behind slow sections, and how to improve and learn from them.
How ION compares to other systems
On average, ION trains travel at about 22 km/h from end to end. That may not sound impressive at first, but it actually puts ION well ahead of many surface transit systems. For comparison, Finch West averages around 13 km/h, and Toronto’s streetcars are even slower, at roughly 11 km/h. ION’s higher speeds are a result of better traffic signal priority, more consistent right-of-way, and newer infrastructure. In short, ION avoids unnecessary slowdowns and can keep moving more reliably.
Internationally, ION also performs well. Many modern European street-level tramways average only at 17-19 km/h. These systems focus on close stop spacing and street integration rather than speed. While they work well in dense cities where driving is expensive, they are not designed for fast travel.
At the same time, ION is slower than some higher-performance light rail systems, such as Germany’s Stadtbahn networks and the LRTs in Edmonton and Calgary, which typically reach 25–27 km/h. These systems benefit from tunnels, fewer stops, and more fully separated tracks that allow trains to avoid traffic altogether.
How ION compares locally
For most drivers, however, ION still feels slow, especially for longer trips. With Conestoga Expressway close to both ends of the line, a trip from Fairview to Conestoga Mall takes about 15 minutes in light traffic and around 30 minutes in rush hour. Compare that to about 44 minutes by LRT.
However, ION shines when compared to the buses it replaced. The LRT is consistently faster than former Route 200 iXpress, saving anywhere from a couple of minutes off-peak to 15–20 minutes during busy periods. And today, the trip from Conestoga to Fairway is usually faster by LRT than by the more direct Route 7 bus.
ION is quite competitive for many everyday trips. From the University of Waterloo to Conestoga Station, ION takes about 10 minutes, compared to 8 minutes by car and 17 minutes by bus. From Uptown Waterloo to Conestoga, ION takes about 14 minutes, while driving can take anywhere from 7 to 16 minutes, and the bus takes about 17 minutes.
Since most riders are not travelling from one end of the line to the other, but instead making shorter trips between major destinations like the universities, Uptown, and Downtown, ION offers a solid and reliable alternative to both driving and buses for daily travel.
Nonetheless, ION can be faster with targeted improvements that can be carried over for phase 2 to Cambridge. Let’s dig into some of them.
Where ION could be faster
We spoke with operators, engineers, and planners who have worked on ION. A consistent message came through: many of today’s speed issues are not caused by major design flaws, but by policies, procedures, and technical settings that can be improved.
In transit planning, there is a saying: “organization over electronics over concrete.” In other words, it is much easier to fix management and signal issues than to rebuild tracks and roads. Fortunately, there’s opportunities to speed up ION from those first two categories.
Fixing the Willis Way Slow Zone
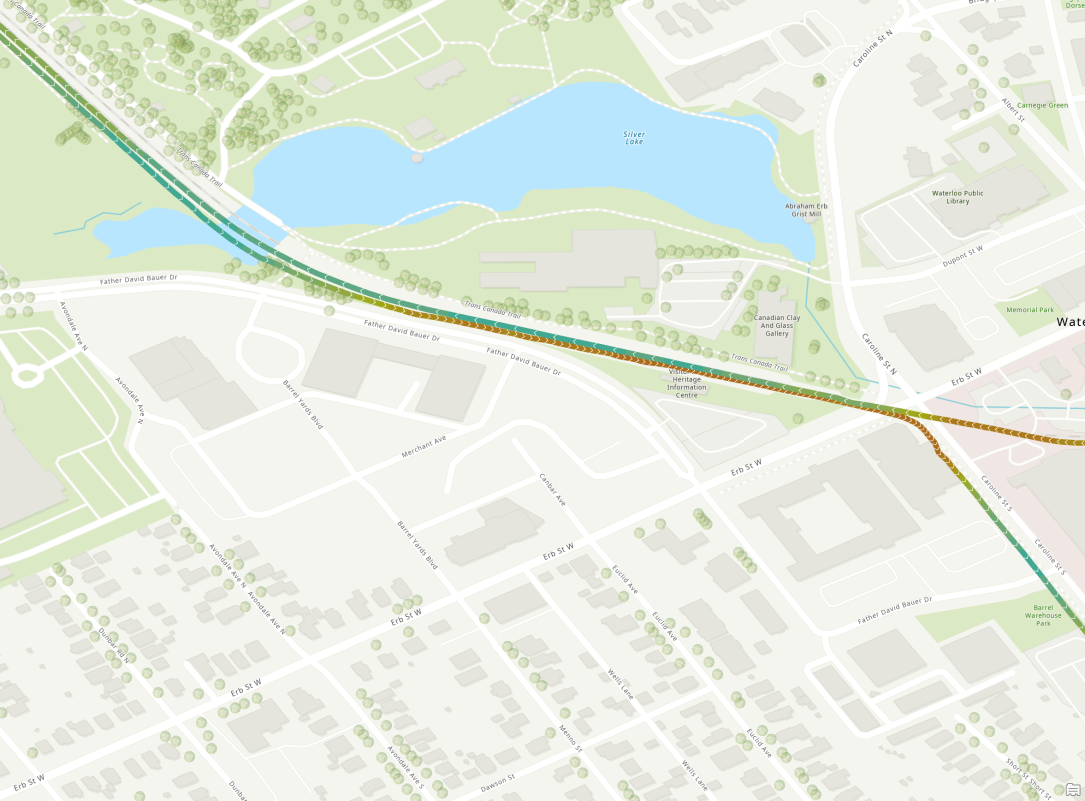
Speed restrictions exist between the Laurier-Waterloo Park and Willis Way stops. When southbound trains approach the Erb-Caroline intersection, the trains slow down well in advance and then crawl to the intersection.
This is due to a temporary speed restriction put in place after a CN freight train damaged switches in 2024. Although the equipment has been repaired, we have heard that the slow zone remains because of an ongoing dispute over who should pay for the repairs: Keolis (who operates the LRT), the Region (which owns the LRT and track) or CN (which operated the freight train that broke the track).
As a result, southbound trains are much slower than northbound trains in this area. Resolving this issue should be a priority, as it represents one of the simplest ways to restore lost speed. CN, Keolis and the Region of Waterloo must come to a long-term agreement to ensure diligence when such mishaps occur to help lift the slow zone as soon as possible.
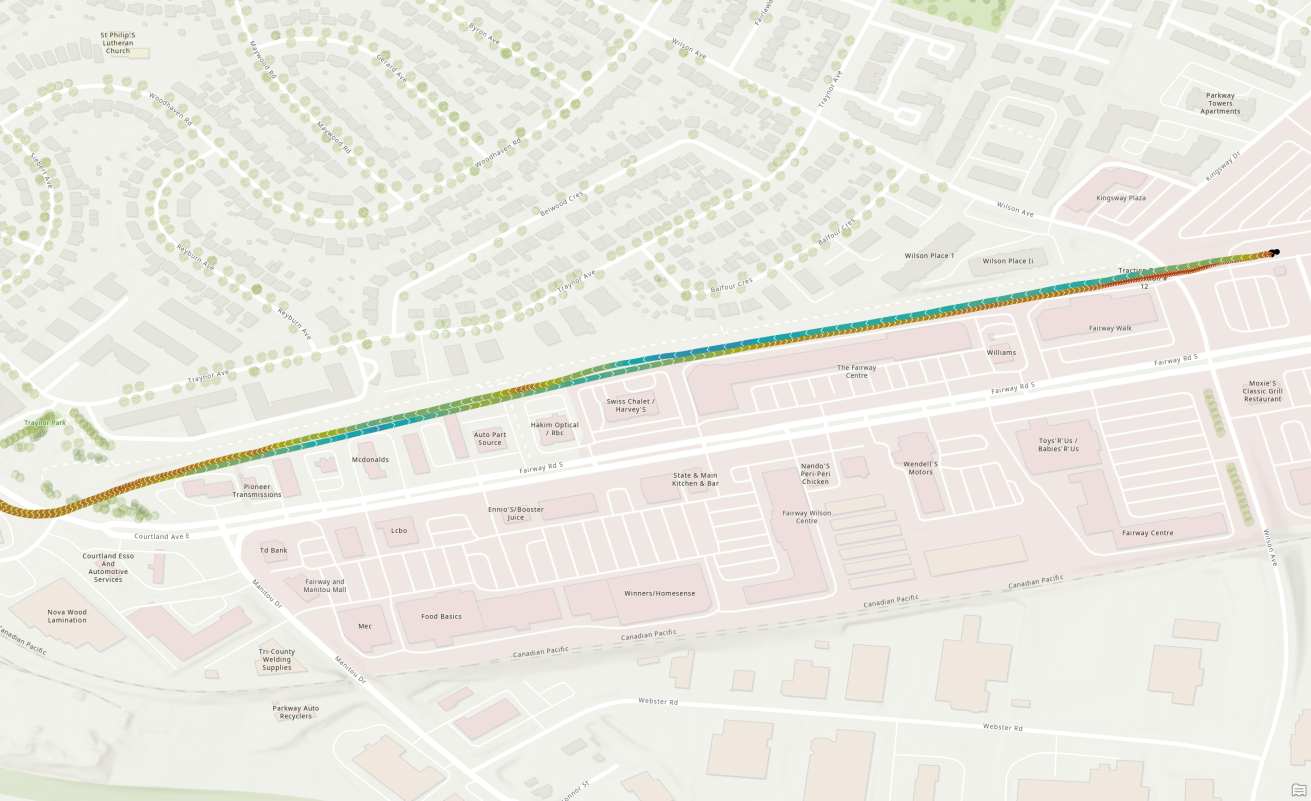
Upgrading the Traynor Crossing
The hydro corridor between Courtland and Fairview was originally one of ION’s fastest sections. That changed after a pedestrian crossing was added without proper signals or boom gates in this area for local residents who were cut off from nearby shopping areas. Since this crossing is unprotected, the LRT travels slower in this section from over 60 km/h to about 20 km/h. This slowdown affects trains in both directions and prevents them from fully accelerating again. It’s truly a shame to only go 40-50 km/h in a section with a dedicated off street right-of-way.
TriTAG wrote about adding a crossing at this location for several years, as we assumed that it would not conflict with train operations being either signalized at-grade or an underpass. Despite hinting at a signalized crossing, the Region left this crossing unsignalized due to a lack of funds. This would be resolved by installing proper signalling and crossing gates, lights and bells similar to other pedestrian crossings along the line.
$6.9m in funding was recently announced for this crossing, along with another at Research and Technology station. Once this is in place, speeds can be gradually increased as people get more familiar with the crossing. The goal should be to restore the initial 70 km/h of this section.
Improving Transit Service Priority (TSP)
ION already has stronger signal priority than many systems, including Toronto’s streetcars. ION’s TSP ensures that car phases are shortened and LRT phases are added to reduce the time ION has to wait for red lights. Simple and inexpensive signal changes could speed up ION by several minutes through denser sections like Uptown Waterloo and Downtown Kitchener where stations are very close to traffic lights.
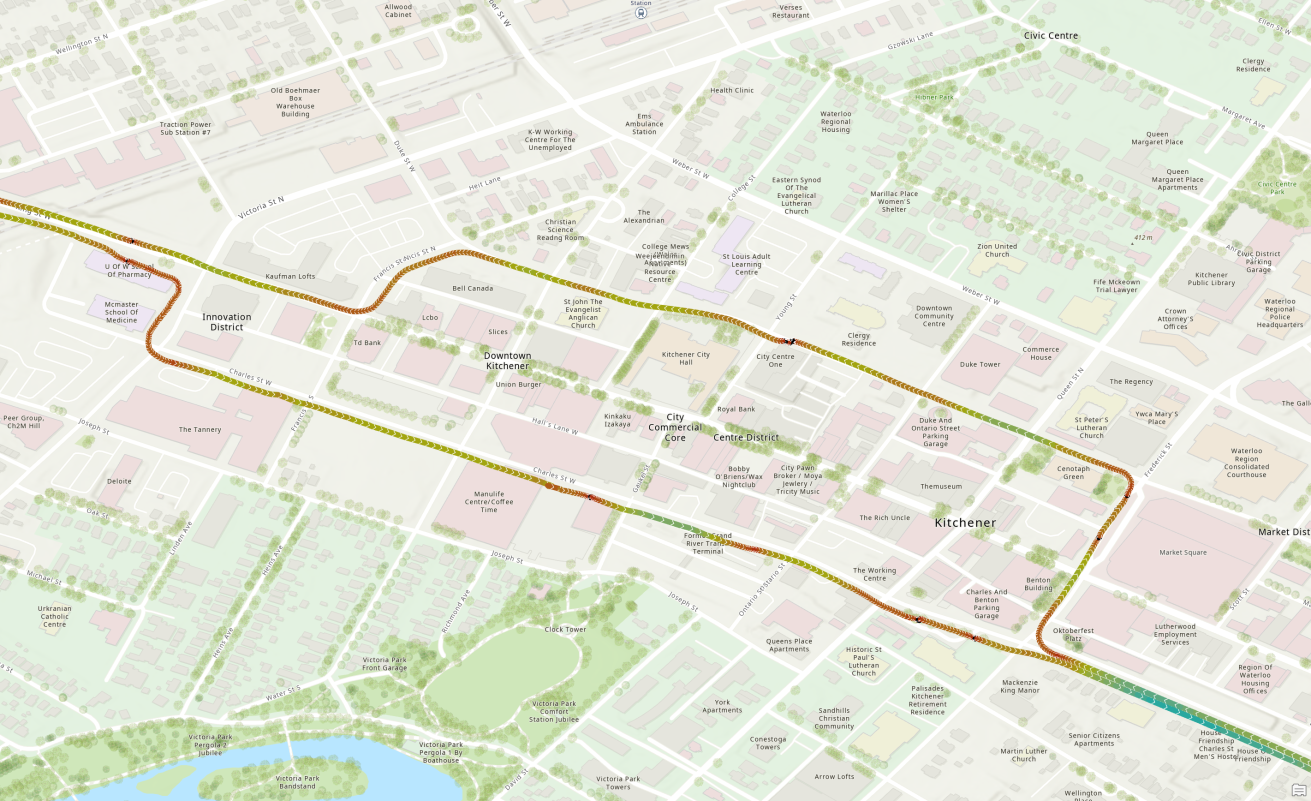
For example, when leaving Kitchener City Hall Station, trains often creep forward a few metres, then sit waiting for a traffic signal to change. Our speed profile analysis shows that signal priority does not always activate quickly enough, especially in the street-running sections of Downtown Kitchener. If trains received stronger “absolute” signal priority after leaving stations, much of this waiting could be eliminated. This would help ION better match car travel times in the urban core, where its speeds are currently the lowest.
Fixing the Automatic Train Protection System
On several off-street sections, ION uses an Automatic Train Protection (ATP) system to control speeds. ATP systems monitor the speed of the train and ensure that the train is travelling at a speed less than the maximum allowed speed for a certain section. If this is not the case, the system activates emergency braking to slow down the train. In theory, this improves safety; in practice, it often slows trains far earlier than necessary.
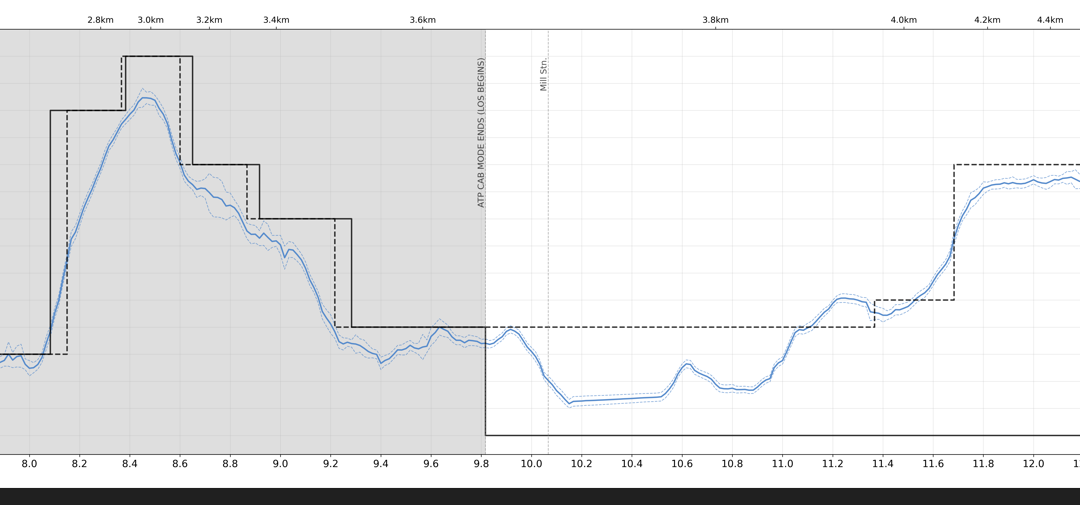
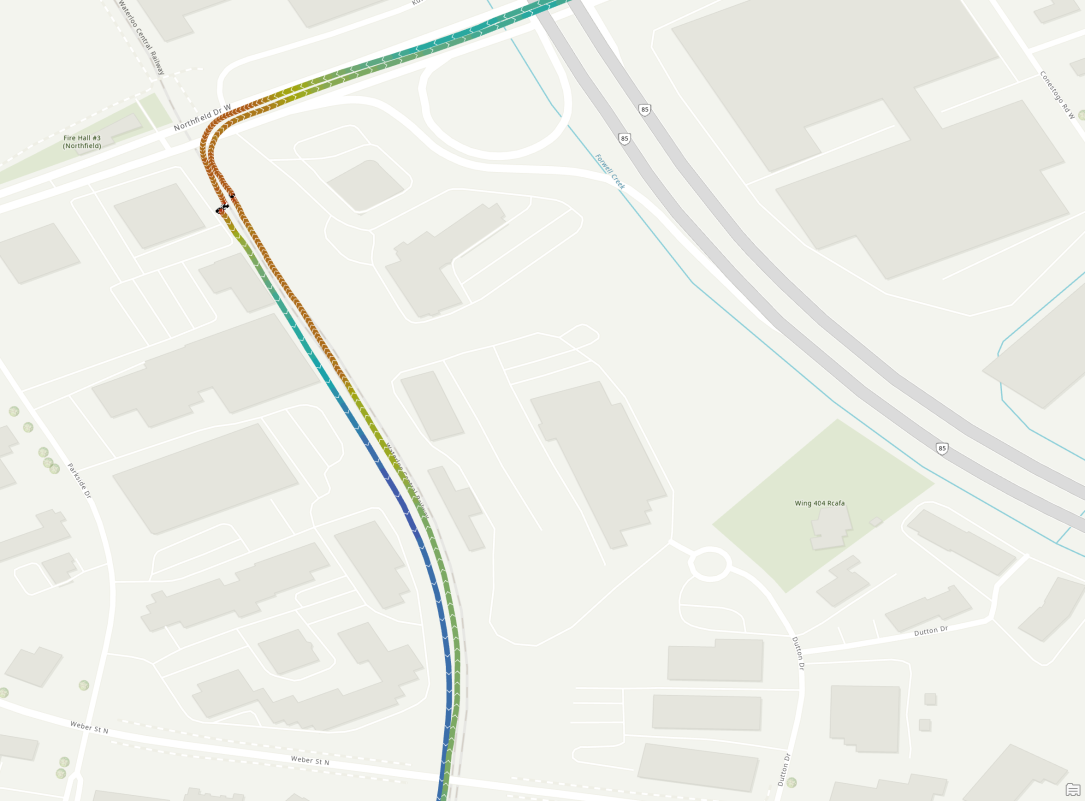
There is currently an ATP tuning issue on sections where the system is active, including between Northfield and Erb/Caroline, and between Mill and Fairway. In these areas, trains briefly reach 60–70 km/h, then slow abruptly to 10–15 km/h hundreds of metres before stations and crawl the rest of the way in.
This creates a sharp contrast between slow approaches and fast departures. For example, on the Huron spur near Mill Station, trains approach at 40 km/h but depart at 70 km/h. This difference is not explained by track design or safety needs.
Similar slowdowns occur at some grade crossings, where trains drop from 50–60 km/h to 40 km/h and then accelerate again. As a result, on corridors designed to be ION’s fastest, trains only reach top speed for very short periods.
Why This Happens
In most systems, there is one ATP beacon for signalling the speed limit to the ATP system and a second beacon to enforce this speed limit. On the ION there is only one beacon doing both jobs, and it is placed far in advance of where slowing is actually needed. The ATP related speed-restrictions should be located closer to where the constraint actually applies, not 200 meters in advance.
The goal of this type of system should not be to enforce the ATP speed limits strictly, but instead to supervise a natural driving style. The ATP is tuned in such a way that it abruptly forces the train speed to be lower, instead of having a suggestion for operators to slow down. This causes something called “ATP jerk” in the industry.
Operators would love to gradually bring the vehicle to a stop, but they have to follow the ATP guidelines causing a very unnatural driving style, because otherwise the system will apply emergency braking which is a rather violent process.
Why It Was Designed This Way
When speaking with engineers and operators, we learned that the system was tuned to allow for trains running in coupled sets of two cars and extreme failure scenarios, such as total brake or power loss. In these cases, trains would still be able to stop in time before a station or a road crossing.
In practice, this is likely an over-cautious approach and an odd requirement as the ION has never had regular service with double trains since it started operating. Major brake failures are extremely rare, the trains have backup air braking systems for these scenarios, and there are minor repercussions if the ION brakes slightly slower in an emergency and over shoots a platform. The boom gates and bells that are already at crossings would likewise alert drivers if a train overshoots on to the roadway.
This ATP problem did not exist when ION first opened. For several months, trains operated under Line of Sight rules, with drivers controlling speed directly, and no major safety issues occurred. The slowdown issue only occurred after ATP was installed and Line of Sight was no longer used in the dedicated corridors like Mill to Fairway, and Waterloo Park to Northfield.
How It Could Be Fixed
Fixing the ATP system will take work, but it is achievable. There are a few options:
- The Region could work with stakeholders to disable ATP until it is fixed and run the whole line as Line of Sight.
- They could make the ATP speed restrictions a suggestion rather than as a requirement.
- Ultimately they could move track circuits forward closer to the true control point.
Improving this system would likely not only speed up trains but could also reduce how early crossing gates activate, helping ION riders as well as those travelling on intersecting roads.
Overly Conservative Speed Limits
It is common for operating speeds to be determined by comfort limits rather than actual track limitations. This can reduce the impact of emergency braking for passengers and the risk of possible derailment. However, ION’s operating speeds are very conservative in curves, crossings, and even straight sections where derailments are uncommon. When combined with the previously discussed issues, this makes trains slower than they need to be.
Each operator drives ION differently, however, they know that the ATP will abruptly force the train speed to be lower, and do not want to accelerate only to decelerate again shortly after crossing an ATP slowdown zone. Therefore in many places, while trains could safely travel at 70 km/h without affecting comfort or safety, operators don’t reach speeds more than 50 km/h. These slower speed limits in certain parts reduce or even completely negate the impact from higher speed limits in other parts.
At road and pedestrian crossings, speeds are limited to 40km/h which is low compared to other cities like Calgary where trains pass comparable crossings at 60-70km/h. The speed along Courtland Boulevard is only 15 km/h.
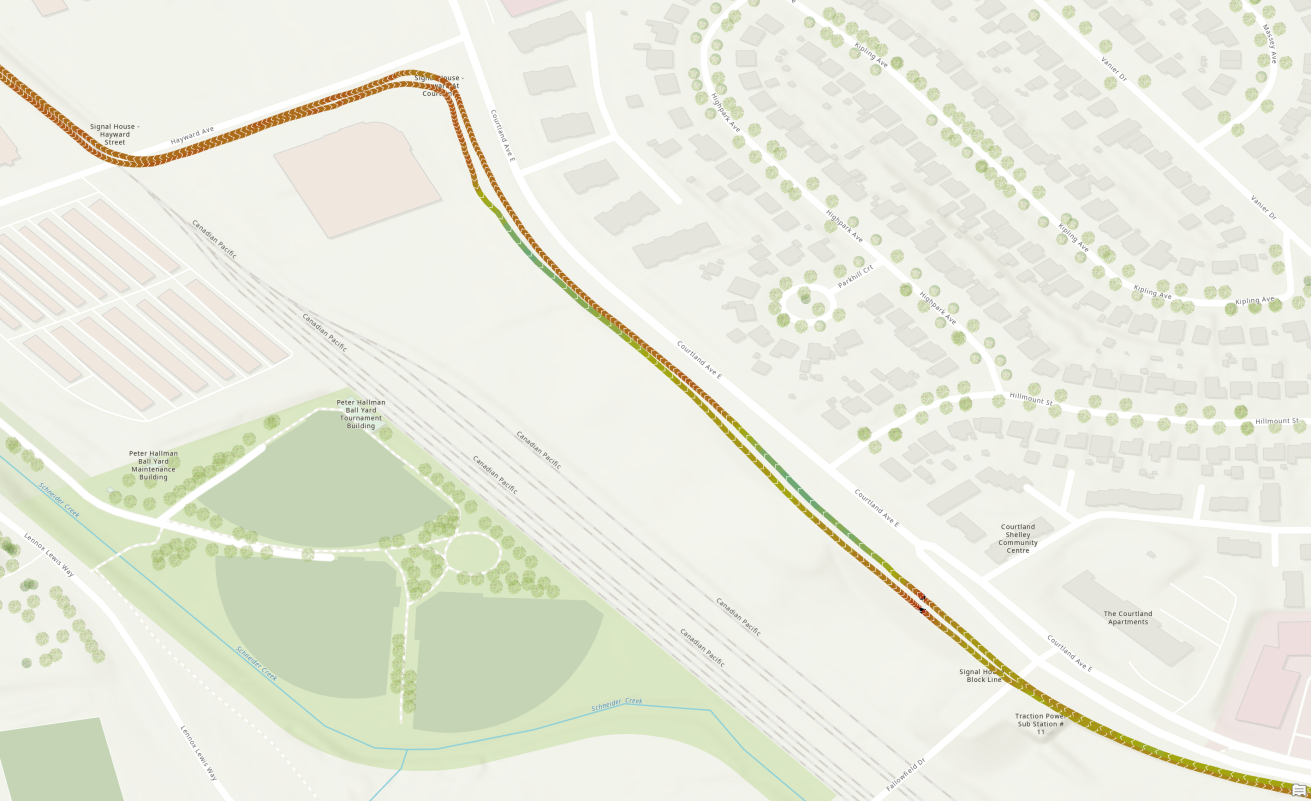
ION takes turns at generally 10-15 km/h, including at Hayward Avenue. However the track geometry is wide enough that in most places it could raise to 15-20 km/h without affecting safety. It is common for trams worldwide to start accelerating in curves after the front reaches a straight track, like in Amsterdam. ION operators instead wait for the entire train to cross before doing so.
In summary, the Region should work with Keolis to re-evaluate both maximum speed limits and operating speeds – and to make sure the operating contract isn’t unduly getting in the way of improvements.
Why These Trade-Offs Were Made
Many of these issues reflect the financial and political realities under which ION was built.
Unlike newer Ontario LRT projects which were fully funded by upper tiers of government, ION was only partially funded by provincial and federal governments and the Region had to cover a large share of the cost (⅓ the budget or around $330 million).
To limit financial pressures like major property tax increases, the project avoided major road reconfigurations and property expropriations. This led to tighter curves and less-than-ideal track layouts in some areas. This also meant avoiding expensive features like tunnels and grade separations. The compromises have resulted in subpar track geometry, such as the Uptown, Downtown and Borden/Ottawa loops that we can see on the ION, especially the sharp double turns at Hayward which stemmed from efforts to reduce expropriation and is easily the slowest single point in the line.
While reducing the potential speed of the line those decisions made the project politically viable – a fair price to pay, given the low cost of the line and the value of the project. And not all of the cost saving measures were bad for speed: lands already owned by the Region of Waterloo like the Spur Rail Line and Hydro Corridor were used to reduce land acquisition costs and construction impacts for the project and are among the fastest sections of the ION today.
Lessons for Stage 2
The good news is that many of the speed challenges seen on ION Stage 1 are already being addressed in Stage 2, such as downtown loops (which cause many 90 degree turns), and extensive on-street operation. The Cambridge extension includes far more off-street and grade-separated sections, reflecting lessons learned from the first phase.
Significant sections of the route between Preston and Pinebush, and from Delta to Downtown Cambridge will use former interurban right of ways that will allow for higher speeds.
As a result, Stage 2 is not expected to be a “slow” service.
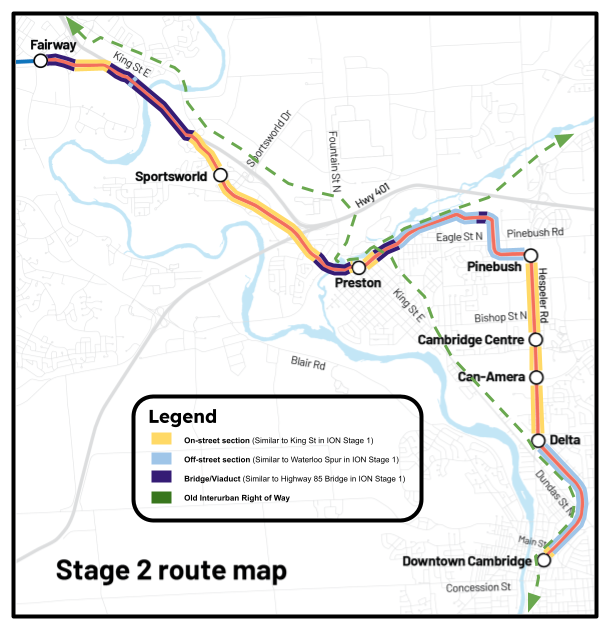
The projected travel time from Fairway to Downtown Cambridge is about 29 minutes over 17 km, which works out to roughly 35 km/h. That is comparable to Toronto’s Line 2 subway and three times as fast than surface routes like Finch West.
Stage 2 will function more like a modern interurban line, with only 7 stations over 17 km, compared to 19 stations over 19 km on Stage 1. This wider spacing supports faster, more regional-style travel.
However, slower sections of Stage 1 will affect the end-to-end speed of the whole line. Over the long term, targeted upgrades in Downtown Kitchener and near Hayward and Courtland may be needed to unlock the full potential of the system.
Conclusions: A Faster ION Is Within Reach
Although ION has travel speeds comparable to most tram systems worldwide, with minimal investment we may be able to get current end-to-end speeds of 43/44 minutes down by 5 minutes or more.
In order of impact, the biggest opportunities are: fixing ATP system issues, removing temporary slow zones, strengthening signal priority, and encouraging more confident operation. Of these, recalibrating the ATP system would have the greatest effect. With proper tuning, trains should be able to cruise at close to 70 km/h between Uptown and Northfield, delivering major travel time savings.
We know that the ION can go faster than it does right now. Whenever the ION is slightly behind schedule, operators regularly push train speeds, accelerate more intensely and make turns slightly faster. The TSP becomes more aggressive and allows trains to clear red light phases earlier. The current system is definitely capable of handling higher speeds but there’s padding in the timetable.
ION is the transit spine of Kitchener-Waterloo and the bus system is designed to feed into it. It should ideally be as fast and as frequent as possible. Speed increases allow us to increase frequency with the same number of trains which is a cost savings.
As the Region grows toward one million residents and traffic congestion increases, ION must remain competitive with driving. Stage 2 offers a chance to address many of these issues from the start, especially around train control and cautious operating practices. Ultimately, achieving these improvements will also require stronger incentives for the operator, Keolis, to prioritize speed and reliability.
We hope this article helps to raise public awareness and encourages Regional Council to negotiate for practical, achievable upgrades.
This post is part of TriTAG's IONizeWR campaign.
Do you want more analysis on the ION LRT, with a focus on how Waterloo Region can improve and expand the system to create a complete, reliable rapid transit network?
Consider subscribing to our IONizeWR newsletter!
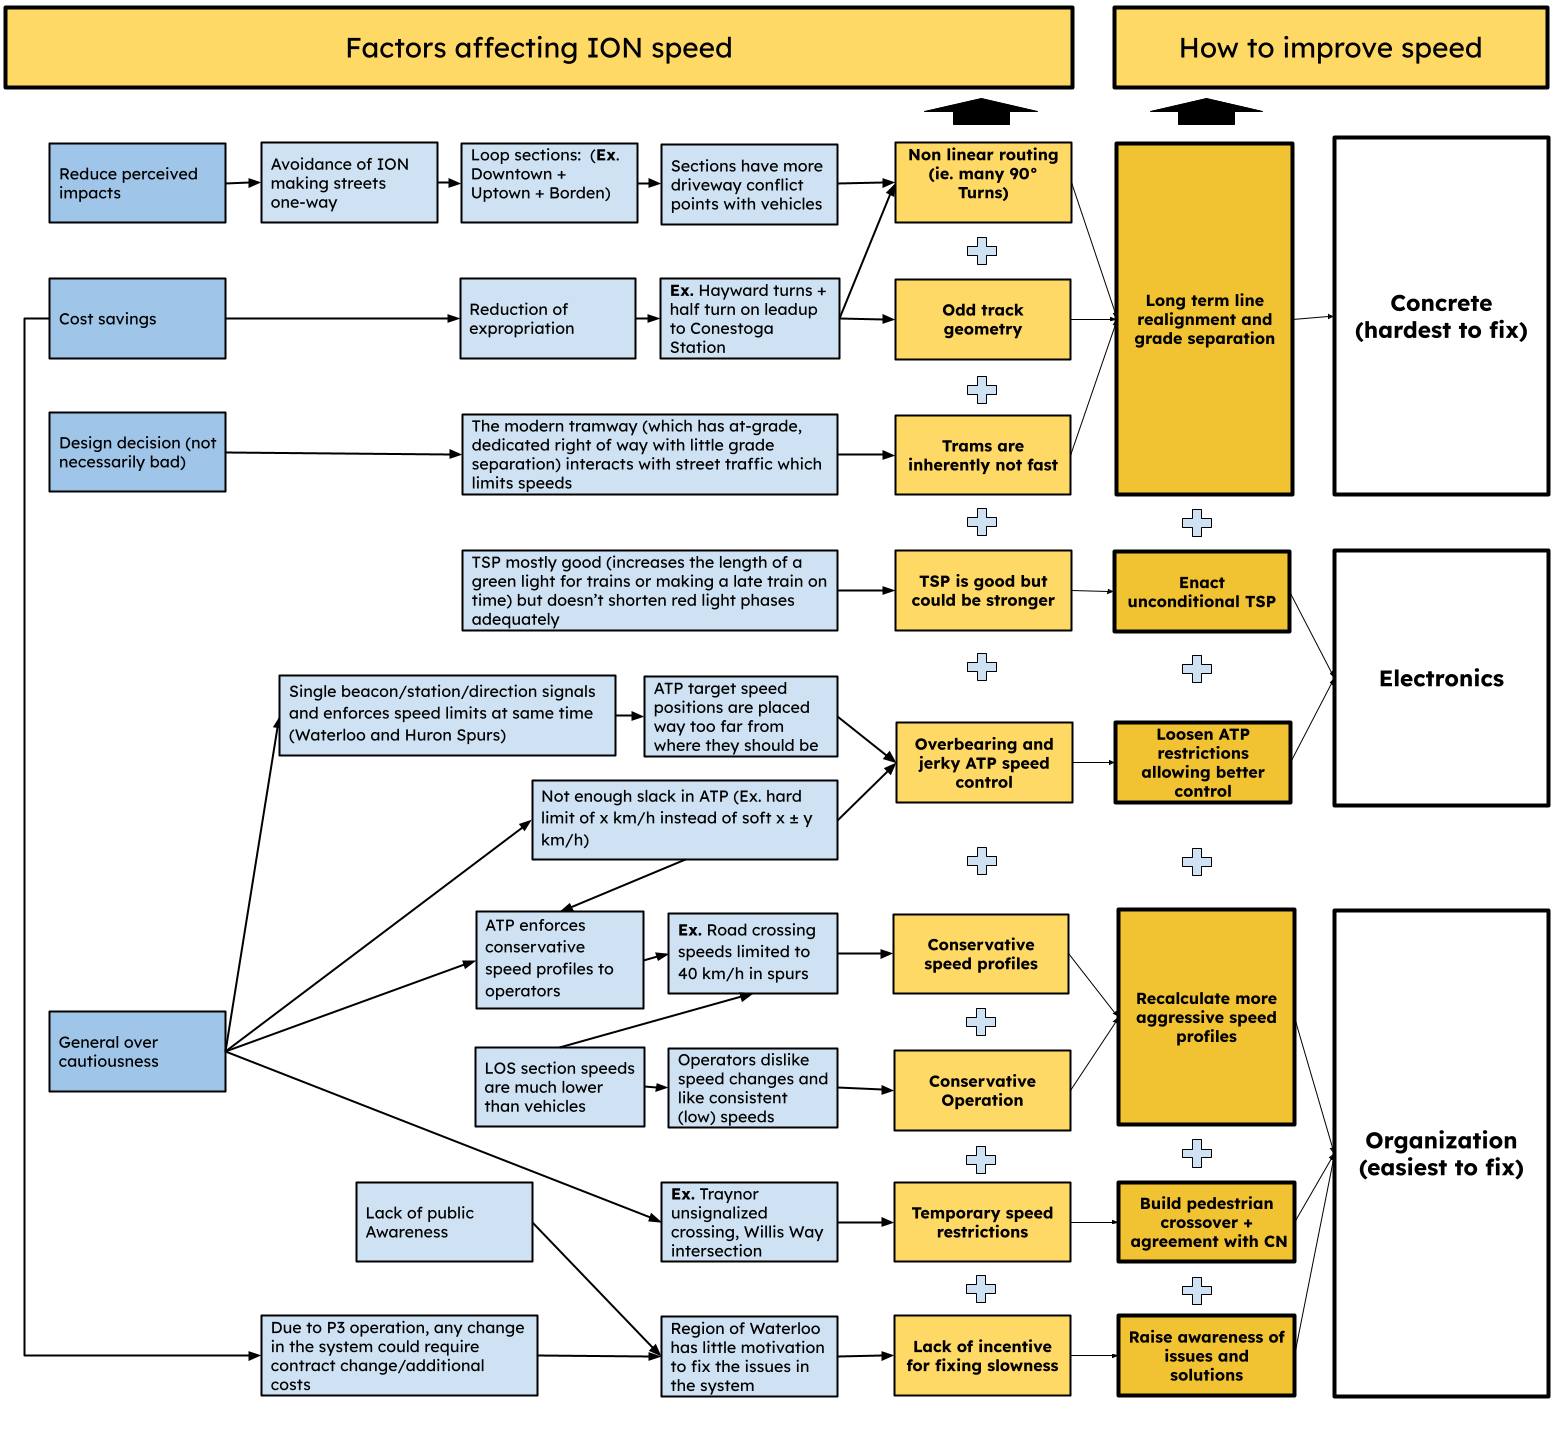
Appendix: Infographic
We have also made an infographic summarizing the issues and solutions discussed in this article:
Appendix: Speed Profiles
Members of TriTAG rode ION 5 times per direction to collect granular speed data using a custom GPS Tracker. The aggregated results are available to download in map and graph formats respectively.