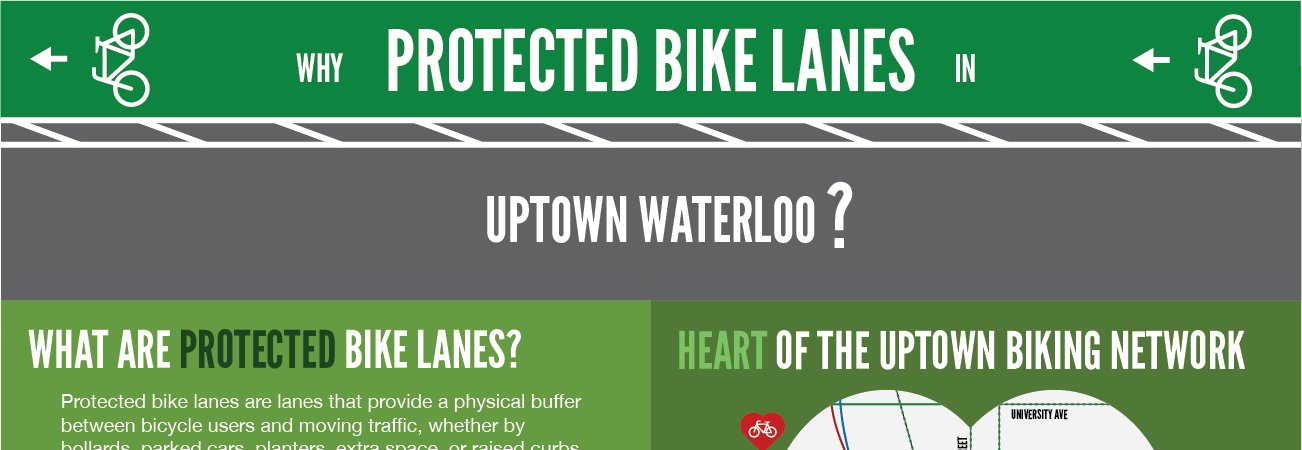
King Street in Uptown Waterloo is being redesigned, and due to popular demand, protected bike lanes are now being considered as an option for the blocks between Erb and Central.
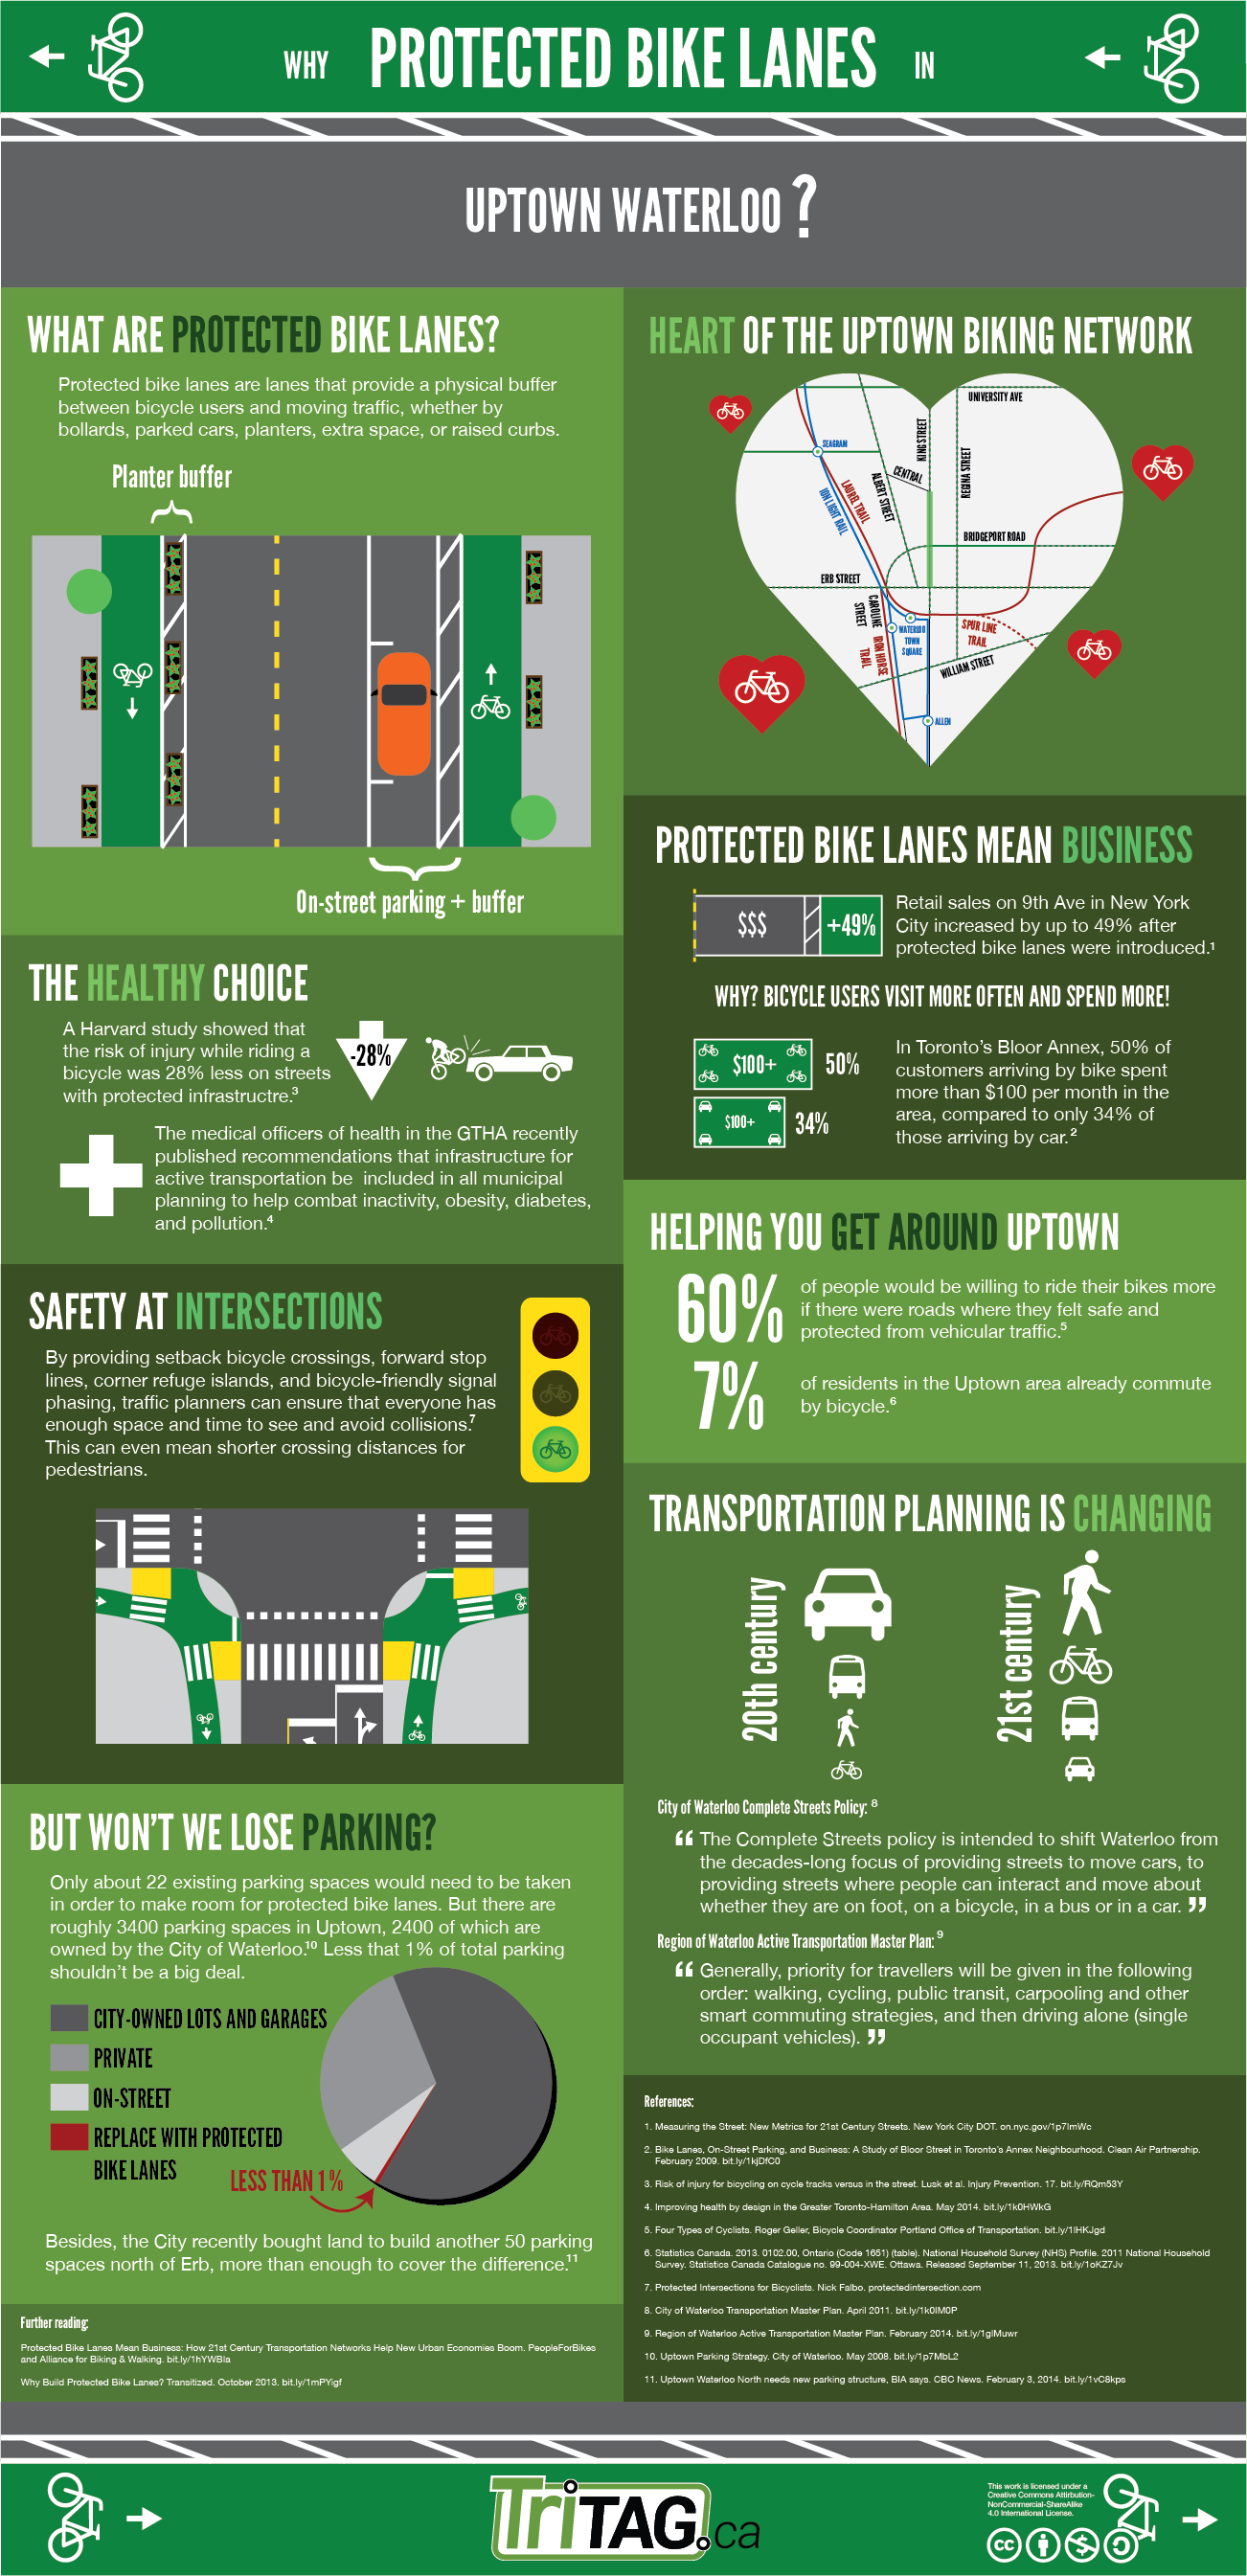
TriTAG is supportive of protected bike infrastructure because it can make bicycling an attractive choice to most people. This is a once in a generation opportunity to make Uptown a truly walkable and bikable place. But businesses have concerns about changes to the Uptown streetscape, so we’ve created an infographic to help understand the benefits and trade-offs of protected lanes.
One of the best ways to voice your opinion on protected bike lanes and the Uptown streetscape redesign is to attend the public consultation on May 29th from 5-8pm at Waterloo City Hall. You can also contact your city and regional councillors, and let the Uptown businesses you love know that you want to be able to shop from them by bike.
(click image for full-sized version – 0.5 MB)
Hey, Mike, as I wrote on Twitter: great work on this.
One piddly note, and I only raise it because you might have gotten the figure from our site: when it comes to retail sales volume, you occasionally see findings that people who arrive by bike spend more per month. But in some of those cases, that is due to the demographics of the people who bike (they tend to be younger and single) and if you correct for demographics, there’s no difference.
In other studies, there’s no difference in monthly spending patterns even before you correct for demographics.
However, I’m aware of seven or eight studies of this issue around the developed world and the common theme in all of them is that bike users never spend less than car users on a monthly basis. This is not only a stronger finding scientifically, I think it’s also more believable. When you say people on bikes spend more, skeptics immediately tend to doubt the veracity of the study. But we intuitively accept that modal choices might not correlate to monthly spending habits.
The real advantage of bike traffic, therefore, is the parking savings. When a store starts getting a substantial share of customers by bike, it starts to free itself from the tyranny of parking space. It gives its customers the choice to park immediately out front every time, if they want to use a bike. Etc. And if you measure the space dollar for dollar, six bikes in an auto parking space are way more profitable by the hour. That’s why we focused on this aspect in our PBLs Mean Business report with the Alliance for Biking and Walking. (See p. 31.)
http://www.peoplepoweredmovement.org/site/images/uploads/Protected_Bike_Lanes_Mean_Business.pdf
I’m about to revise our statistics page to reflect this thinking, which is why it’s on my mind.
Again, great work on this. In fact, other folks might actually want to repurpose. Any chance of sharing the layout file?
Hi Michael, thanks! I was wondering why I couldn’t access your stats page when helping a colleague prep for a radio interview :)
To give a little local context, the conversation in Waterloo isn’t around bike parking vs car parking at the moment. While the bike posts can get crowded, the BIA is actually investing in more bike racks (though they’ll need to find more if protected bike lanes draw in more traffic…) I’d considered including the 19c vs 69c per sq ft figure, but thought it might cloud the issue a little and make it look like we were making an argument for more bike parking.
But your point of protected bike lanes serving as a tool to help businesses reduce parking demand is well taken, especially as the City looks to eventually redevelop its prime real estate surface lots, while businesses grumble about wanting even more free parking (ostensibly for customers, but quite often for their employees).
I tried to include some nuance in the spending figures, but I’ll refine it further if this infographic or its contents get revised. At TriTAG, we try to be able to back up our public assertions, while at the same time making our points memorable and simple to grasp and share.
Thanks
Mike
Makes sense. The retail messaging is complicated and I doubt we’ve got it perfect yet. Highly dependent on the context, I think, as you suggest.